
Just a quick post to cap the week. Sentiment extremes where everywhere you looked, even on Twitter. Images and a few comments below. Also some links to outside articles.
Bottom line:
- A rally is imminent: All but one of the elements were in place by Friday morning (2008-10-10) and Friday’s intraday reversal might have been that last element. We won’t know until next week, but I did buy late in the day.
- Regardless of when the tradable rally develops, based on current information and thinking, we are likely at least halfway to the bear market low (in terms of time and price), but less than halfway through the recession.
- While sentiment reached an extreme Friday morning, it doesn’t mean it reached the extreme of this cycle.
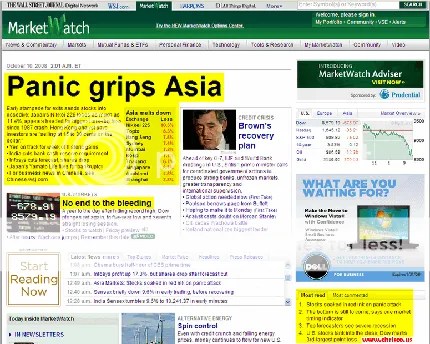
That’s about as extreme a page grade as you can get (“page grading” is scoring everything from newspaper and magazine covers to web pages and other virtual and real-world streams). I did see an even bigger headline after the open, but you get the point, extreme sentiment readings were everywhere (more shown below).

This was one of the images going around email. Anger.

This was going around email too. Humor.

And this was the main image on the Washington Post website. Fear like a trapped animal (that’s what he is, actually, at least in his mind). See “How to survive the global panic” for interesting discussion of fear contagion.
The main image on The New York Times website was a large interactive stock market chart showing in real-time (or slight delay) the plunging Asian and European markets (sorry, no screenshot, but you can imagine what it looked like).
What did the market do in the face of all this?
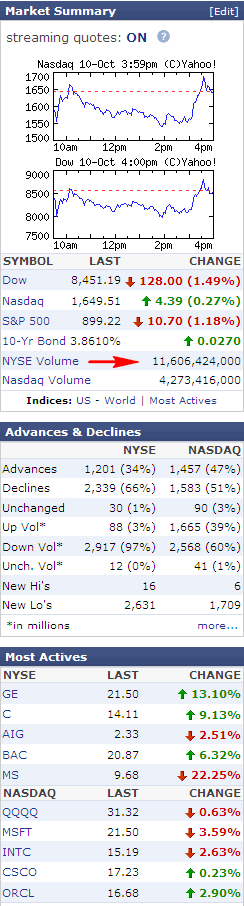
The DJIA plunged 697 points (8.1%) at the open and then rallied 1018 points (12.9%), before easing back 128 to close up 569 points (7.2%) from the low, but down 128 points (1.5%) from the previous close. The NASDAQ closed with a small gain, as did a number of stocks.
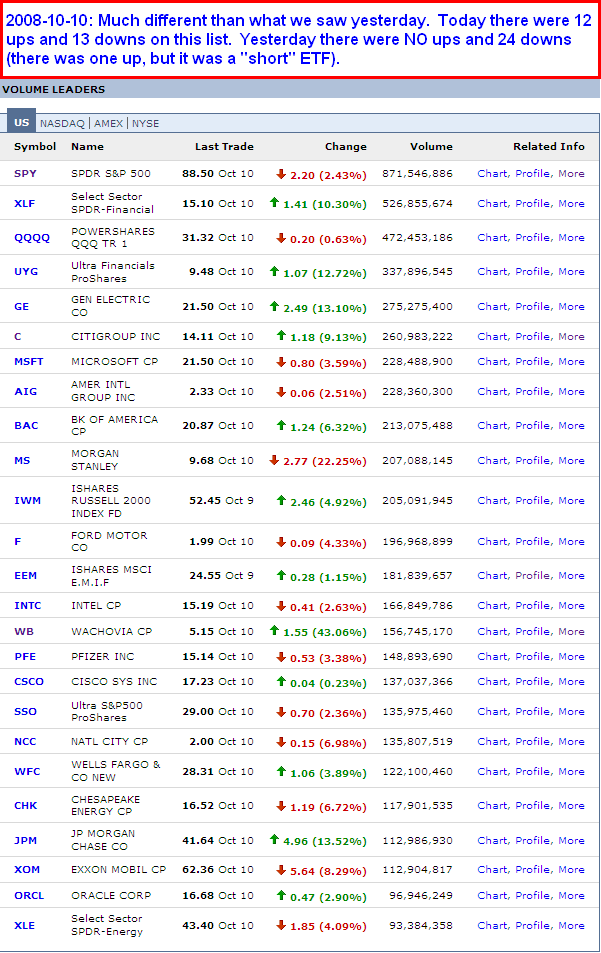
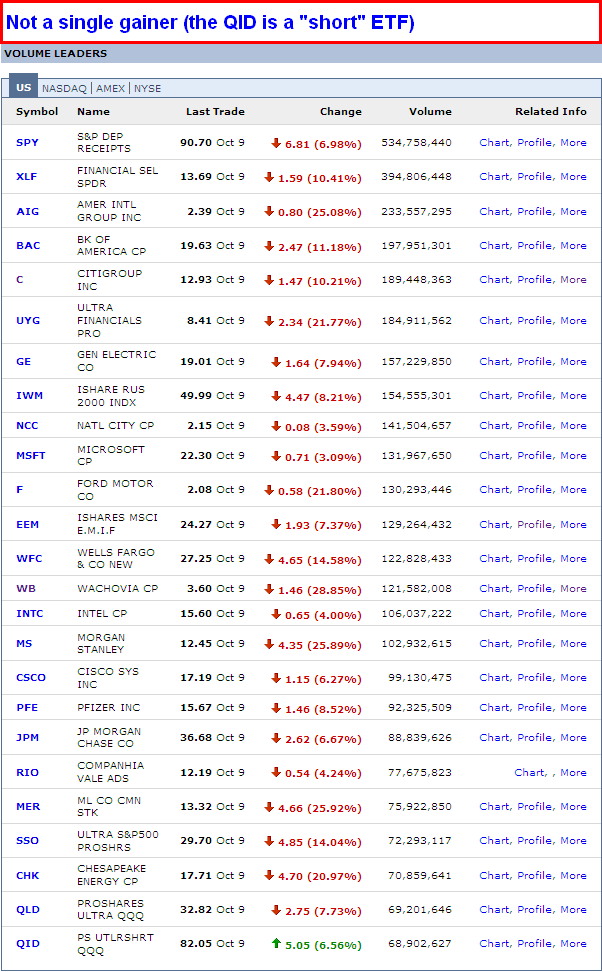
Here is today’s most active list and summary. And here is yesterdays: most active, summary. You can see the difference: Yesterday no stocks up on the most active list, today 12 out of 25 up, and may of those had been down big earlier in the day. Note: Today’s list is at least somewhat skewed because of the bank-stock rally, in anticipation of “big” weekend news (coordinated announcement).


Just before and after the close today I bought some Philip Morris (PM) and OptionsExpress (OXPS). Stop loss below today’s lows. Definite whipsaw risk as today’s lows were pretty low, but my position size was small and as noted here, I’ve been almost completely in cash since August — in fact for the most/all of the 1-year old bear market (except for a few very short-term trades), such as the January low).

This chart is the NASDAQ 100 ETF Options Volatility Index. Today it put in a big reversal candle (the long upper shadow).

This 16-year quarterly S&P 500 ETF (SPY) chart shows the prior bull and bear market. As you can see, both bull markets peaked at about the same level. What I’ve highlighted on the chart is the fact that the current bear market has almost declined the same amount as the first one, but has done so in 12 months vs. 31 months (2.6x faster). This could be interpreted in at least two different, and contradictory, ways:
- This bear market is more powerful and faster moving and will decline farther (price) and/or longer (time).
- This bear market is more efficient and will reach its bottom sooner (time, but price is still a question mark).
- Other?
Anyway, just some grist for the mill.
Now on to Twitter (BTW, I’m “chrisco” on Twitter):
(and if you want 100% size images, click here and here)
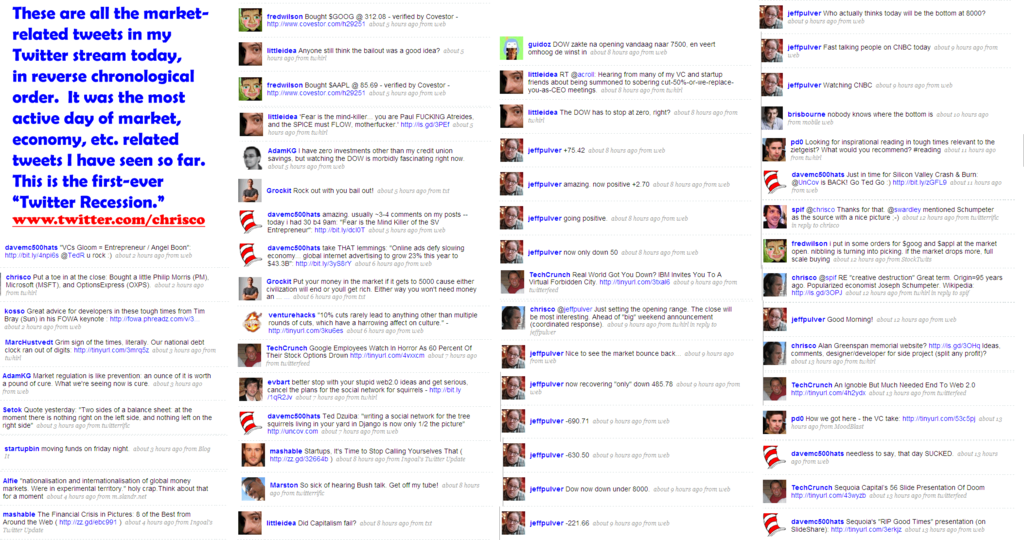
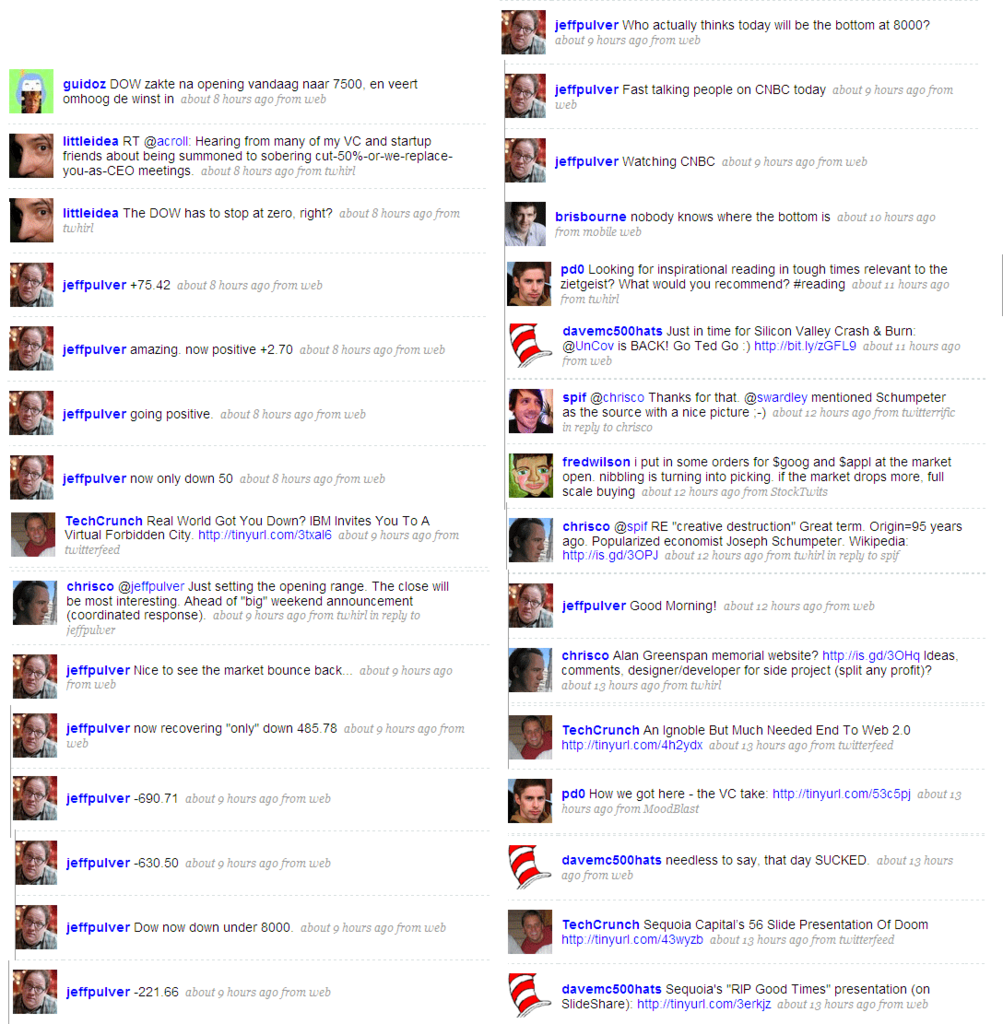
This is the first “Twitter Recession,” by which I mean this is the first recession since the birth of Twitter. That means instant sentiment readings through the flow of tweets. It’s like having the patient hooked up to a machine — that’s exactly what it is, actually. And the patient had a major fever this morning (Nouriel Roubini said “cardiac arrest” about the credit markets recently). Click the image above for the market-related tweets in my small stream.
Some closing comments:
As noted yesterday and the day before, this week looked like a possible slow-motion capitulation. And this weekend some sort of coordinated announcement is expected. Whether it will do anything to stop the panic is left to be seen. We won’t know that has happened until we a massive rush of buying come in, followed up within two weeks by more massive buying. Significant volatility will likely continue for some time.
Even when major buying comes happens, there is still that little matter of the nasty recession, which will include one or more cycles of falling demand, layoffs, falling revenues, profit margins, and earnings, retrenchment. Along with that will come rising business and consumer defaults, etc. So any low that is put in may not be the final low of the bear market, which normally doesn’t come until 6-9 months before the recession ends (and we are almost certainly not there yet).
More commentary and links to articles in yesterday’s post.
A few weekend magazine home pages:


Ok, I will close this post now. Having laid all this out, I will be the first to say that it really doesn’t mean anything one way or the other. Just because sentiment got extreme does not mean anything in and of itself. Extreme sentiment can become more extreme, as we saw this week, which started at extreme and got more extreme until peaking Friday morning and then backing off some (and/or some short covering). Price action determines everything. Price action is the truth. The only thing we can be sure of is that the volatility is not over and the recession is not over, in fact it’s still building momentum.
UPDATE #1: Here are some articles and links that may be of interest. I don’t have time to explain why they are interesting, which at times can be the exact opposite as what most people would think. Think of the market (and life) as a big poker game, with real information, misinformation, missing information, deducible information, bluffs, tells, double bluffs, triple bluffs, and more. Decisions have to be made under time pressure and with imperfect information and in a psychologically charged environment. You get the idea. In order to read that poker game, you have to be paying attention, know how to read it, know when and how to act, and how to manage risk. What’s often most important is not what is written on the lines, but what is in between them. Sorry to have to add all that, but the first comment on this post suggests that some explanation may be required.
- BLOOMBERG: “Chesapeake CEO Sold `All’ Stock to Meet Margin Calls“: McClendon, 49, owned 33.5 million shares, or 5.8 percent of the company’s common stock, according to a Sept. 30 filing with the U.S. Securities and Exchange Commission. He was the company’s third-largest shareholder.

- [Same article]: McClendon is the second oil chief executive officer in as many days to reveal company stock sales. XTO Energy Inc. Chief Executive Officer Bob Simpson sold more than $101 million of stock, according to an Oct. 8 filing with the Securities and Exchange Commission.

- WSJ: “Wild Day Caps Worst Week Ever for Stocks“: The Dow Jones Industrial Average capped the worst week in its 112-year history with its most volatile day ever, as hopes for a major international bank-rescue plan were overwhelmed at day’s end by another wave of selling. Some investors who normally would be jumping to buy beaten-down stocks after a 22% drop over eight trading days said the relentless declines have left them shell-shocked and unwilling to take new risks. Some spent the day trying to protect themselves from further declines. After regular stock trading ended, the G-7 nations agreed on guidelines to address the crisis, but stopped short of the kind of concrete action plan investors had sought, raising the risk of further market chaos.
- [Same article]: The blue-chip average is down 40% from last October’s record, its biggest decline since 1974. Investors who normally would be buying stocks after such heavy declines are standing back, says Henry Herrmann, chief executive of money-management group Waddell & Reed in Overland Park, Kan. Traders watch stock prices as they work on the main trading floor of the New York Stock Exchange. “You make a decision and you look dumb the next day,” Mr. Herrmann says. “So you go to gold, and then gold is down. You go to Treasurys, they rally, then they get their noses punched in.” His firm overall is holding 22% to 23% of its assets in cash, one of the highest levels ever. A reason is to protect clients and the firm, so the firm won’t have to make forced sales if clients start cashing in their mutual funds — something Mr. Herrmann says is just starting to happen. “I have been doing this since 1963. There has never been anything close to what we are experiencing now,” he says, referring to the market pandemonium. “Maybe one day in 1987 was close, in terms of absolute riot. But this is happening every day.” “Some stocks are selling at fire-sale prices,” adds Jack Ablin, chief investment officer at Harris Private Bank in Chicago. “But the way this market has broken down, it needs to rally by 15% or 20% to get enough momentum for us to get back in.”
- [Same article]: Other forced sellers included Coca-Cola Enterprises Inc. director Marvin J. Herb, who said J.P. Morgan Chase & Co. had seized 18.6 million of his shares in the bottler, and had already sold nearly 1.4 million of them for $17.7 million “pursuant to a credit arrangement.” J.P. Morgan has indicated it plans to sell the remaining shares, Mr. Herb said in a regulatory filing.

- istockanalyst.com: “There’s No Stock Market Crash Yet Aka My Take On Capitulation“: Imagine for a second you’ve been a dip buyer–probably a sissy value investor/wannabe Warren Buffett “buy into fear” aka I fear how many morons out there think they’re wise/experienced/mature/disciplined enough to be part of the 10% of traders who make money instead of failing, losing $ and becoming part of the problem, not the answer–at Dow 11k, 10k, 9500, 9200, 9000, 8800…You’re down big, bigger every few hours/days and you can’t understand why the market is not bottoming like the experts/gurus/bloggers/talking heads/reason tells you it should?!?!? You keep adding to average down your cost basis so there’s still a chance you can make it back… And there’s a ton of people doing that right now…the problem is they haven’t capitulated nor do I think they’re even close to. They haven’t thrown up their arms and sold their dip-buying-positions because they still think there’s hope. The damn media and talking heads who say recovery in 2009 have got everybody all excited about hope and they’re responsible for making people dumber…and now poorer. In individual stocks, falling knife chart patterns USUALLY last a longer than people expect and there’s rarely any quick rebound, if any rebound at all. More importantly, the steepness of the decline mirrors the bottom in 2002, but we forget that 2002 was after big drops in 2000 and 2001, meaning all those dip buyers–yes, they were around back then too–were finally giving up…right now the dip buyers are just starting so I’d be surprised if they gave up anytime in the next few months as we’ve really only had 1 year of downside…typically, we need another 1-2 before we get any true panic. Meaning plenty of downside. In short, who the hell knows where the bottom is, the downside pattern is just beginning, at least historically…we might get a snapback rally, but everyone is expecting a snapback rally, which makes a snapback rally less likely which means we could/should get a serious panic that discards all historical norms and teaches everyone that technical analysis is an inexact science, especially when combined with non-transparent over-leveraged carcasses of companies.
- cnbc.com: “Was That The Bottom?“: Trader after trader said to me that that this is an environment in which picking a bottom has resulted in nothing besides further losses. So let’s let it be for the moment. What matters most is when we are going to see real buying; until we do, moving sideways does not have the feel of sustainability.
- marketoracle.co.uk: “Stock Market Bottom, Are We There Yet?“: We will give up the first 10% and the last 10% of the coming rally to get the middle 80%. Why? Because we don’t like to be stabbed by trying to repeatedly catch falling knives and go through the psychological torment of getting in, getting stopped out, getting in again and getting stopped out, etc. It is too taxing and draws down on both financial and psychological capital. The rally will come out of the blue when people are just so worn down and sold out that they stand in awe, disgust and regret when they see it. We are overdue in price, and just about right in time for it to happen. Like a watched pot that never seems to boil until you walk away, the rally will catch most people by surprise.
- timesonline.co.uk: “How to survive the global panic“: The fastest-spreading contagion known to humankind swept through Britain this week, causing raised blood pressure, spiralling stress-hormone levels and rash economic actions galore. The contagion is an outbreak of mass panicked anxiety. Fear-driven flock instincts are to blame for spreading social anxiety and severe unease. The sense of fear grows because [people] swap ever larger doses of worry with each other. The human brain spots fearful expressions faster than any other emotion, says a Vanderbilt University study, in which a dozen participants studied photos of scared, neutral and happy faces. The volunteers consciously recognised fearful expressions a half-second quicker than other images. Unconsciously we react even faster: the amygdala – the brain’s anxiety centre – spots signs of fear in less than two-hundredths of a second. We can even smell each other’s fear, reports a Rutgers University study in Perceptual And Motor Skills, which asked men to wear absorbent pads while watching clips from a funny and a scary movie. The pads were put in jars and presented along with neutral control pads. More than three-quarters of the women and more than half the men were able consciously to identify the smell of fearful men. Thus worry ripples through a crowd in a manner called “emotional contagion”. At this point, things can rapidly spiral. As Daniel Goleman, the author of Emotional Intelligence, explains, the presence of anxiety heightens the intensity of people’s emotional interactions so that those who feel threatened and anxious are especially prone to catching other people’s anxiety and then passing on more of it. From here on, shrill words of reassurance from rattled politicians may prove as self-defeating as Corporal Jones’s cries of, “Don’t panic! Don’t panic!” We’ve seen such intense emotions driving the stock market this past week, where one day the FTSE 100 plunges, the next it strongly recovers. Such behaviour accords to “the law of patterned herding”, says Robert Prechter, the director of the Socionomics Institute, in Georgia, and a pioneer in the emerging field known as neuroeconomics. He reports in The Journal of Behavioral Finance that when faced with volatile markets, even the most adventurous investors head for safety in numbers, thanks to their unconscious herding impulses. When a stock’s price rises, demand tends to increase, but when prices are low few people want to buy, he says, but this is the opposite of what happens in the grocer’s shop. It also contradicts the economic theory of what is supposed to happen in stock markets, where the best way to make money is to buy low and sell high. Bernard Baruch, the legendary Wall Street stock trader of the early 1900s, understood this phenomenon well. “All economic movements, by their very nature, are motivated by crowd psychology,” he declared. In the Great Depression, Baruch advised President Roosevelt to use the theory of mental contagion to change the course of panicked public feeling. Roosevelt conducted relaxed fireside radio talks to allay public anxiety, which included his famous statement: “You have nothing to fear but fear itself.”
- New York Times: “How This Bear Market Compares“: Interactive chart (image below):
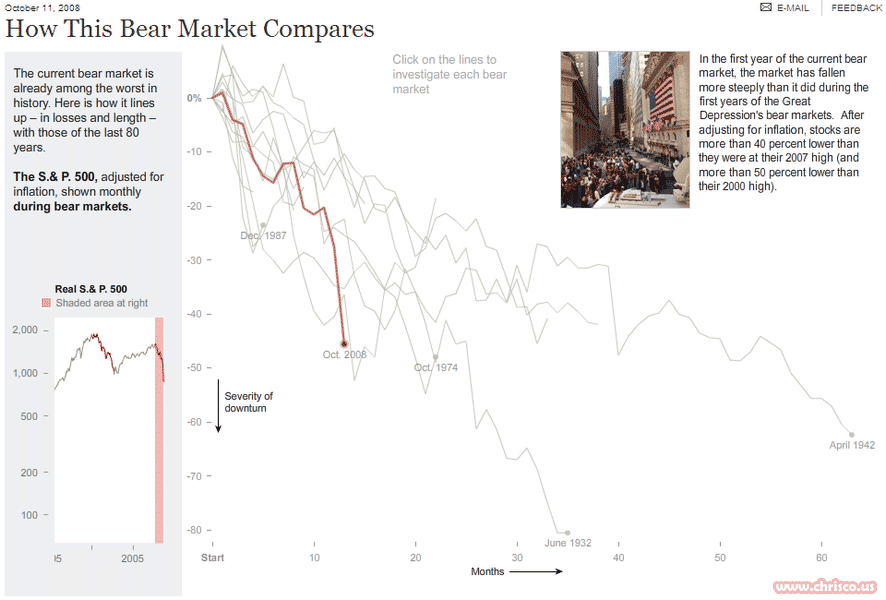
(click for larger image)
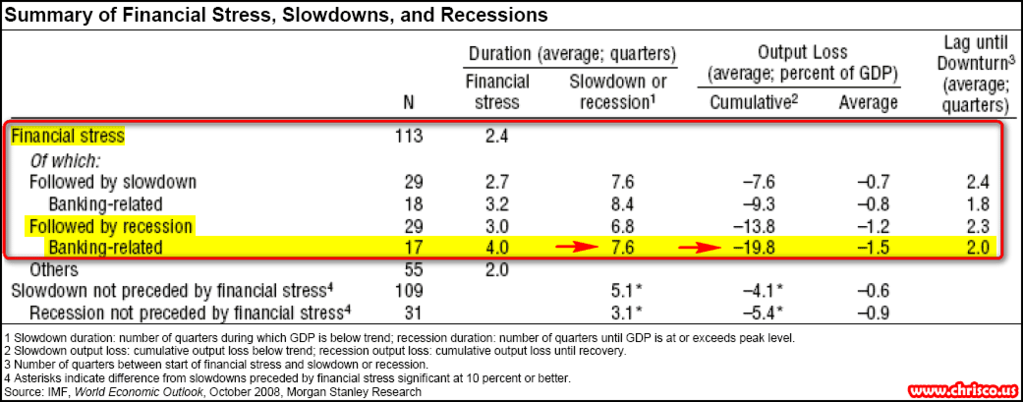
- Downunder Daily: “Stress Fracture”: These comments apply to the chart below: The typical recession that is not preceded by financial stress lasts for 3.1 quarters and is associated with a cumulative output loss of 5.4% (output lost relative to trend). The typical recession that is accompanied by banking-related financial stress lasts for 7.6 quarters and is associated with a cumulative output loss of 19.8%. (There are 17 cycles that fit into that latter category.) Banking-driven recessions involve larger cumulative output losses in part because they are deeper. As importantly, banking-related downturns produce a larger output loss because they last longer.
- Thoughts from the Frontline: “Letters of Credit: Going, Going Gone?”: Just as the business world is dependent upon commercial paper as its life blood, the world of global trade depends on letters of credit (LOC). Without LOCs, the world of trade quickly freezes up. If you are a manufacturer of a product and want to sell to someone outside your borders, you typically require a letter of credit from the buyer before you load any cargo at a port. A letter of credit from a prime bank is considered to be proof of your ability to pay. It not only can be a source of ultimate payment, it can be a source of inventory financing while goods are in transit. And if you are a business which is buying a product, you do not want to release money until you know the product is on the way. There are buyer’s and seller’s agents who make sure these things happen seamlessly, and world commerce had grown because of it. Now we are starting to get anecdotal evidence that this extremely vital market is also freezing up. If you think the problems stemming from a meltdown with the commercial paper markets are threatening to the world economy, they are small potatoes when compared to a seizure in the letter of credit markets. I had been thinking about this for a few weeks. Then an article posted on Naked Capitalist caught my eye. Quoting: “At the end of the day, if every counterparty is bad then you don’t have a market and you don’t have an economy. I spoke to another friend of mine this afternoon, whose father has been in the shipping business forever. Pristine credit rating, rock solid balance sheet. He says if he takes his BNP Paribas letter of credit to Citi today for short term funding for his vessels, they won’t give it to him. That means he can’t ship goods, which means that within the next 2 weeks, physical shortages of commodities begin to show up. THE CENTRAL BANKS CAN’T LET THAT HAPPEN OR WE HAVE NO ECONOMY, LET ALONE A CREDIT SYSTEM.” And they quote the following story from The Financial Post of Canada: “The credit crisis is spilling over into the grain industry as international buyers find themselves unable to come up with payment, forcing sellers to shoulder often substantial losses. “Before cargoes can be loaded at port, buyers typically must produce proof they are good for the money. But more deals are falling through as sellers decide they don’t trust the financial institution named in the buyer’s letter of credit, analysts said. “‘There are all kinds of stuff stacked up on docks right now that can’t be shipped because people can’t get letters of credit,’ said Bill Gary, president of Commodity Information Systems in Oklahoma City. ‘The problem is not demand, and it’s not supply because we have plenty of supply. It’s finding anyone who can come up with the credit to buy.’ “So far the problem is mostly being felt in U.S. and South American ports, but observers say it is only a matter of time before it hits Canada. ‘We’ve got a nightmare in front of us and a lot of people are concerned it’s going to get a lot worse,’ said Anthony Temple, a grain marketing expert based in Vancouver. “Access to credit is key to the survival of maritime trade and insiders now say the supply is being severely restricted. More than 90% of the world’s trade by volume goes by ship. ‘The credit crisis has made banks nervous and the last thing on their minds is making fresh loans,’ Omar Nokta, an analyst at investment bank Dahlman Rose, said in an interview with Reuters. “While shipping has always been a cyclical industry whose fortunes rise and fall with the global economy, analysts said the current crisis over the drying up of credit is something they have never seen before.” If banks are refusing to go into the LIBOR market and lend to each other, then why would they want to take a letter of credit either? At first, it will be a small trickle, which is how the commercial paper meltdown started. Then it will be a flood. The one good sector in the US is its export sector. Start slowing that down due to a lack of ability to ship or receive payments and see what happens to an already shrinking economy. If anyone wants to see how the credit crisis can affect Main Street, look no further. It is hard to overstate the problem and the potential for it to create a true economic meltdown. It must be dealt with, and soon. See more below.
Subscribe to this blog via RSS or email.
Check out the latest BuzPal t-shirts here!


I don’t think that the audience or participant on Twitter are going to be very helpful for you to gauge sentiment or find unique investing insights. I’m not saying it’s impossible, I’m saying that the effort will not be worth the once in a blue moon insight. The average Twitter user is not that informed in how to invest, how to trade, and how to manage risk.
Barrons:
“Hedge Fund To Use Twitter Posts To Judge Market Sentiment”:
http://blogs.barrons.com/focusonfunds/2010/12/22/hedge-fund-to-use-twitter-posts-to-judge-market-sentiment/?mod=rss_BOLBlog
(also on Bloomberg, etc.)
Hi Allan,
Thanks for your comment, although the point is not at all to look for investment ideas from Twitter. I hope nobody does that, because if they do they are not thinking for themselves, and thinking for yourself if kind of a key in life, my friend 🙂
Also, you 100% can see sentiment extremes on Twitter. Just look at the image. Compare that to a typical day and you will see it’s an extreme, in fact I’m guessing the most extreme reading ever registered (at least the most extreme I’ve ever seen).
Whether or not you know how, what, or when to make use of the information is another story. It’s really just for fun and just an observation, so don’t get read too much into it or get yourself worked up (tough week in the market?).
Regarding “average Twitter user is not that informed in how to invest, how to trade, and how to manage risk”: This blog post was not about that at all and if it was it would be saying the exact same thing. Duh?! I hope nobody thinks that because someone is on Twitter they know anything about investing, trading, or managing financial risk! That would be something, though 😉
Final point is that, with this type of sentiment reading, we are NOT looking for “professional” investor sentiment, we are looking for extreme sentiment among non-professional investors and/or the semi-professional investors, which is exactly the case here (again, just look at the stream).
Cheers,
Chris
StockTwits nails stockpicking on Twitter, raises round:
By Eric Eldon
2008-12-17
http://venturebeat.com/2008/12/17/stocktwits-nails-stockpicking-on-twitter-raises-round/
http://stocktwits.com/ a two month-old site that lets you track messages on micro-blogging service Twitter about public company stock performance, has closed a first round of venture funding. The investors, all individuals, are a wide range of Twitter-loving finance types who have become addicted to the service.
[See the link for the rest of the article]